IRNT is still short bias. Management canceled the conference call, refused to provide earnings guidance and the CEO quit all just now.
Some Short bias
XLE NERV MPLN STAR WISH NAIL JWN EXPR
Some long bias
PXMD FREY JWEL JDST

September 15, 2022
September 4, 2022
Long and Shorts Continue To Work
It sure has been awhile since I posted here. I've been busy with daytrading full-time. I continue to be amazed at how many long biased traders there are along with stocks running up staggering amounts. This past week we saw the IPO frenzy long and short. I've been shorting IPOS like FRZA and longing bounces on ones like PXMD. There is never a lack of opportunity long or short in this market. It's such a bullish market at times stocks with high short interest and 30% of the float short or more have been squeezing. Stocks like APRN FAZE VERU. FAZE might just run again. You can also find easy opportunity on the short side shorting multi-day breakdowns on stocks like PETQ YSG. There are crazy supernovas to short like NERV recently as well. I recently started using Tradersync.com to track and analyze my trades. I have found a lot of success trading Crude Oil long and short with options and stock via USO. It trades well off technicals in trends.
I recommend Tradersync if you are investing even as it tracks your performance. The other popular one is Tradervue. You can just save your trades from your broker with a couple clicks and upload directly to Tradersync or Tradervue.
On the long side CLAR stock dropped over 40% on no news or catalyst. Management came out with a statement that they intend to buy back stock. I see some rotation into fertilizer plays like LXU CF BIOX now. I like the fundamentals on NU going forward. Looks like they will grow earnings very well.
April 7, 2022
Technical Analysis of Crude Oil and Russell 2000 Index
Small-caps gauged by the Russell 2000 index or ticerk IWM made a failed bull signal on the breakout attempt in late March. I circled the day it started then failed to hold. A failed signal can be a powerful chart pattern. I expect us to test the lows soon and most likely blow through support much lower. Likely the S&P 500, Nasdaq, Dow Jones will follow. The next chart is the important price of oil. This is USO the ETF for crude oil futures. It is trying to find support on this trend-line I drew. It is currently a triangular bullish consolidation chart. The next couple days will be very telling on the next direction of oil. If it goes down the next couple days the run on oil could be over. Mortgage rates just rose at a historic pace and I expect the housing market to slow down. I think it's likely the economy slows significantly.
Oil chart
Russell Small-caps (IWM)
Oil chart

Russell Small-caps (IWM)

March 3, 2022
Bitcoin Double Top Forming
Here is some brief technical analysis on Bitcoin and the ETF GBTC. It couldn't reach a new high last winter and looks to be a clear double top formation starting. I drew another red line where there is some support. If this support gets taken out and price keeps dropping that is confirmatin of a top and we won't see new highs for some time. The chart is telling us there is likely more downside to come. If one is asking "is it a good time to buy Bitcoin?" the chart is telling us to wait.
February 14, 2022
Oil and Energy Continue to Perform
Crude oil continues to breakout and show high relative strength. It is a momentum breakout even as the overall stock market falls and continues to put up big red days. I see it as a high inflation play but regardless it is unstoppable at the moment. I'm fairly overweight energy in my long-term account and have been trading USO calls.
I like PBR Petrobras here with it's high increasing dividend payouts. It has increased the dividend greatly the last three quarters and it looks like big payouts are in the future. The floor for dividend payouts is $4 bil according to the company for this year and they see this increased payout contnuing for a few years.
They have reduced long-term debt considerably. They are looking for 60%-80% of free cash flow to be payed out in divdends. I noticed the stock chart while screening breakouts and then I saw the high dividend. The yield with the stock at $14 a share is roughly a 14% div yield here if things go as planned. The worst case dividend yield scenario is a 4.4% yield. I'm bullish on oil and see this as a good pick up here. It is coming off a bull-flag today.
August 12, 2021
TLT Short Setup
Long-term T-bonds look like a top was in. It did a technical top formation and took out support. They have just rebounded and kissed right off the old support line that is now resistance. Very text book action going on here. The fundamentals are when rates go up bonds go down and it looks like that is going to play out if the FED is forced into a corner with rates because of inflation. I think shorting bonds is a good play here. I am looking at the TBT ETF. 


July 15, 2021
Small-caps Lagging Large-caps
I've been posting on Twitter lately about how the Russell 2000 Index via the ETF IWM has been lagging behind the other major indices like the Nasdaq and S&P 500. Historically a lot of people believe small-caps are a leading indicator in the economy. It makes sense as they are one of the major employers in the country and a good gauge on the consumer. This inverse correlation has been going on awhile now. I think if the Russell goes down and breaks below this trading range it is a good signal that the majors will follow. I'm watching this.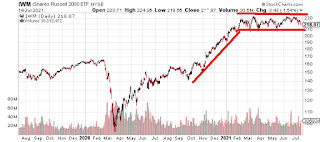


May 20, 2021
Bitcoin Technical Analysis
Here is a long-term Bitcoin chart. From late 2020 through April 2021 it was a textbook uptrending chart. Notice the higher lows I drew under. When there is a "pull-back" it quickly recovers and keeps going. It did this four times as you see from my lines. It started going range-bound after the top as momentum slowed. The two orange lines show the rough trading range. It finds resistance, comes down and finds support and this continues. The crack of that support in late April was when momentum died off and it hasn't recovered. This was a "technical breakdown." Old range support is now resistance. It is more of a bearish chart at the moment meaning sellers are in control. It isn't a buy here unless momentum comes back and it starts to breakout to highs again. I see it just bouncing around going sideways or flat out crashing for a bit. The more I look at the chart the more I see a rounding top formation that I drew up in the second chart. This is definetiely a topped out chart. 


April 20, 2021
High Dividend Yield Income ETF's
Here is a good list of some high yield Exchange Traded Funds (ETFs) that I researched. I was looking specifically for funds that had minimal declines during the Covid crash in Jan-March 2020. I looked at these closely and have a high level of confidence in them as sustainable with that limited volatility. The Pimco one PFN I already own and it had a decline but I like the yield and even with the expense ratio it is a very good fund for me that I have had for years. The Vanguard BLV was pretty steady during those volatile months in 2020. First Trust Preferred Securities and Income ETF (FPE) is actually an actively managed fund. I like that flexiblity in a fund. Here are the funds I found and their current dividend yield.
Vanguard Long-Term Bond Index Fund ETF Shares (BLV) yield of 3.17%
First Trust Preferred Securities and Income ETF (FPE) 4.83%
PIMCO Income Strategy Fund II (PFN) yield of 9.2%
Invesco KBW Premium Yield Equity REIT ETF (KBWY) 8.67%
April 14, 2021
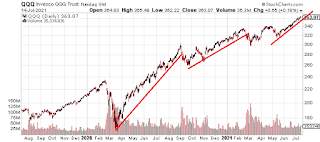
Fedex FDX
I bought some Fedex FDX in my long-term account a week or two ago. I posted it on Twitter then. I liked the chart and it has a history or running after earnings reports. I haven't seen many small-caps I like with SPY QQQ leading the pack lately. I am looking at high yield ETFs and will post some of my favorites soon. I have always liked the Pimco (PFN) but I have a good list now too. I also am looking at stocks with high yield like ticker SUN and T
Subscribe to:
Posts (Atom)