...

November 23, 2022

Stock Market Rally Continues

Since my recent posts about the market rally the major indices have held a steady uptrend. What I am seeing now is bonds especially in the ETF HYG actually "leading" equities higher. This happens from time to time in history. TLT and government bonds are leading too. I've been on Twitter a good bit and I am surprised more people are not paying attention to this. You heard it here. The bull momentum in many sectors is strong escpecially pivotal sectors like homebuilding and construction. This is seen in ETF's VNQ XHB.

I now see stocks continuing to move higher after the economic data is currently being shrugged off. A slow grind higher seems to be in the works. Even QQQ is acting bullish. I always stay open-minded and seperate fundamentals from trend when need be as we are seeing now. I learned in 2009 often major bottoms begin and continue on bad economic data and bad corporate news. Fighting an uptrend is futile. The market is always forward looking. Here are some charts to add a little clarity to the bullish sentiment.
hyg stock
qqq chart
vnq chart
xhb homebuilders chart candles

October 23, 2022

Stock Market Bear Rally In the Works?

I have been looking at the major stock market indices closely lately for signs of a real rally. The Russell 2000 index of small-cap companies ticker IWM has shown rising support levels in an uptrend. There isn't confirmation of a new trend up yet but the setup is there. So many stocks are oversold near-term I see a bounce in the market as a likely scenario. If we don't bounce here there will just be a much bigger short-term rally in weeks to come. Here is the support area on the bottom yellow line for IWM. It's a pretty solid level that keeps getting support. There is also a downtrend breakout seen over the top diagonal yellow line. We are testing this level currently. It's roughly the same with SPY QQQ's.


You would think tech would need to be strong to see a market rally and it is making progress here. I put a bollinger band up on here and you can see when it breaks through either top or bottom the momentum continues awhile. I'd like to see it break over the red line also. That's been a key level. Let's see what it does next week.


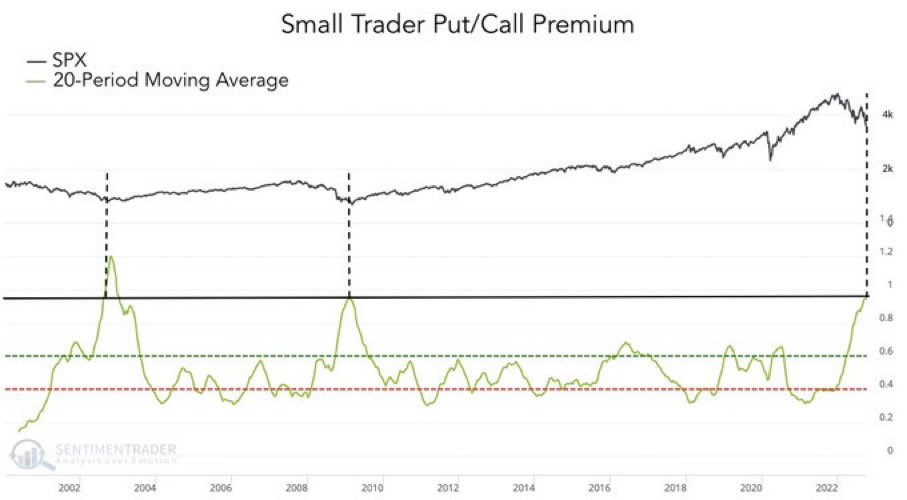
The small-cap put to call ratio is showing historic signs of a bottom forming.


I noticed the energy sector is making multi-month highs. XLE has been very strong. My understanding is that crude oil is in a sweet spot for their margins. Still I wouldn't expect such a big move and if the market is going to rally a bit something has to lead right?

October 17, 2022

Possible Rally Setting up on Stock Market

I posted on my trading blog DynamiteStocks.com about a potential major low taking place right now on the major indices. Here is a chart of SPY the S&P 500 ETF. The breakdown failure was of epic proportions and a top 10 percentage reversal from 52 week lows in history. The red day yesterday is now wiped out too as the market ripped all after hours session. I am not looking to get into any multi-day short positions at this time as I think this rally could get legs. In 2008 at market lows there was a fairly similar bear trap. It is too early to tell if this is a long term bottom but it has the makings of what could be. I remain neutral day to day to see how it plays out but this has my attention. Failed signals can be powerful chart signals.
spy

September 15, 2022

Watches for 9/16/2022

IRNT is still short bias. Management canceled the conference call, refused to provide earnings guidance and the CEO quit all just now.

Some Short bias

XLE NERV MPLN STAR WISH NAIL JWN EXPR

Some long bias

PXMD FREY JWEL JDST

September 4, 2022

Long and Shorts Continue To Work

It sure has been awhile since I posted here. I've been busy with daytrading full-time. I continue to be amazed at how many long biased traders there are along with stocks running up staggering amounts. This past week we saw the IPO frenzy long and short. I've been shorting IPOS like FRZA and longing bounces on ones like PXMD. There is never a lack of opportunity long or short in this market. It's such a bullish market at times stocks with high short interest and 30% of the float short or more have been squeezing. Stocks like APRN FAZE VERU. FAZE might just run again. You can also find easy opportunity on the short side shorting multi-day breakdowns on stocks like PETQ YSG. There are crazy supernovas to short like NERV recently as well. I recently started using Tradersync.com to track and analyze my trades. I have found a lot of success trading Crude Oil long and short with options and stock via USO. It trades well off technicals in trends.

I recommend Tradersync if you are investing even as it tracks your performance. The other popular one is Tradervue. You can just save your trades from your broker with a couple clicks and upload directly to Tradersync or Tradervue.

On the long side CLAR stock dropped over 40% on no news or catalyst. Management came out with a statement that they intend to buy back stock. I see some rotation into fertilizer plays like LXU CF BIOX now. I like the fundamentals on NU going forward. Looks like they will grow earnings very well.