August 12, 2021
TLT Short Setup
Long-term T-bonds look like a top was in. It did a technical top formation and took out support. They have just rebounded and kissed right off the old support line that is now resistance. Very text book action going on here. The fundamentals are when rates go up bonds go down and it looks like that is going to play out if the FED is forced into a corner with rates because of inflation. I think shorting bonds is a good play here. I am looking at the TBT ETF.
July 15, 2021
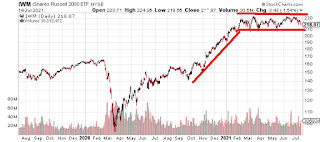
Small-caps Lagging Large-caps
I've been posting on Twitter lately about how the Russell 2000 Index via the ETF IWM has been lagging behind the other major indices like the Nasdaq and S&P 500. Historically a lot of people believe small-caps are a leading indicator in the economy. It makes sense as they are one of the major employers in the country and a good gauge on the consumer. This inverse correlation has been going on awhile now. I think if the Russell goes down and breaks below this trading range it is a good signal that the majors will follow. I'm watching this.
May 20, 2021
Bitcoin Technical Analysis
Here is a long-term Bitcoin chart. From late 2020 through April 2021 it was a textbook uptrending chart. Notice the higher lows I drew under. When there is a "pull-back" it quickly recovers and keeps going. It did this four times as you see from my lines. It started going range-bound after the top as momentum slowed. The two orange lines show the rough trading range. It finds resistance, comes down and finds support and this continues. The crack of that support in late April was when momentum died off and it hasn't recovered. This was a "technical breakdown." Old range support is now resistance. It is more of a bearish chart at the moment meaning sellers are in control. It isn't a buy here unless momentum comes back and it starts to breakout to highs again. I see it just bouncing around going sideways or flat out crashing for a bit. The more I look at the chart the more I see a rounding top formation that I drew up in the second chart. This is definetiely a topped out chart.
April 20, 2021
High Dividend Yield Income ETF's
Here is a good list of some high yield Exchange Traded Funds (ETFs) that I researched. I was looking specifically for funds that had minimal declines during the Covid crash in Jan-March 2020. I looked at these closely and have a high level of confidence in them as sustainable with that limited volatility. The Pimco one PFN I already own and it had a decline but I like the yield and even with the expense ratio it is a very good fund for me that I have had for years. The Vanguard BLV was pretty steady during those volatile months in 2020. First Trust Preferred Securities and Income ETF (FPE) is actually an actively managed fund. I like that flexiblity in a fund. Here are the funds I found and their current dividend yield.
Vanguard Long-Term Bond Index Fund ETF Shares (BLV) yield of 3.17%
First Trust Preferred Securities and Income ETF (FPE) 4.83%
PIMCO Income Strategy Fund II (PFN) yield of 9.2%
Invesco KBW Premium Yield Equity REIT ETF (KBWY) 8.67%
April 14, 2021
Fedex FDX
I bought some Fedex FDX in my long-term account a week or two ago. I posted it on Twitter then. I liked the chart and it has a history or running after earnings reports. I haven't seen many small-caps I like with SPY QQQ leading the pack lately. I am looking at high yield ETFs and will post some of my favorites soon. I have always liked the Pimco (PFN) but I have a good list now too. I also am looking at stocks with high yield like ticker SUN and T
Subscribe to:
Posts (Atom)


