As the market continues to be weak I am going to start looking for cheap stocks below net current asset value and net tangible asset value. I just ran a strict scan looking for super discounted assets. This is the first scan I have done in awhile for these as I never thought it would produce much in the most recent bull market. This scan is cherry picked from criteria of price-to-book value of .5 or less, long-term debt to equity less than .3 and return on equity over 1.
The most interesting ones are Vaccitech plc (VACC) with NCAV of $187 million and a market cap of $89 mil. VACC has postive earnings this year with $.22 last quarter and $.42 the quarter before that. Cash has been pretty stable the past year and currently it has $200 mil in cash.
We also have TD Holdings, Inc. (GLG) with $154 mil in NCAV and a market cap of $59 mil. Not as much cash as VACC as the large majority of the current assets are in account receivables. They had a couple recent slightly positive quarters of $.02 earnings per share and $.05. The stock has tried to bottom and has been sideways for months with support around $1.00 a share.
December 23, 2022
December 14, 2022
Stock Market Top Bull Trap Set
You may remember my blog post from late October where I outlined the scenario of a stock market bottom. I gave the exact levels it would need to break through to confirm and had a good read on the price action down there. The very bottom came on CPI day in October. It was also a bear trap. A bear trap is where the price action begins to go lower enticing sellers and short sellers to sell. What happens though is the momentum quickly shifts back to bullish as price fails to continue to go lower. We saw an epic bear trap on that October day. It was one of the largest reversals from a 52 week low in history.
You may or may not have noticed that on CPI day this week the market shot up early but fell after the CPI news. It was another trap!! And on CPI day again! Maybe it's a big coincidence or the CPI and inflation expectations are the main driver of equities during this time. Inflation is one of the biggest economic factors affecting consumers and businesses these days and not to mention the FED's decisions. We can see the two CPI days in this chart and how it is breaking the uptrend line. It tried to reclaim trend support on the CPI day which was yesterday and that is when we got the big failed signal. Failed signals are powerfull. It will take something special to continue higher from here. I'm not yet fully committed to this being the top but if we see a break of the yellow line around 389.50 on SPY it's game on for more lows.
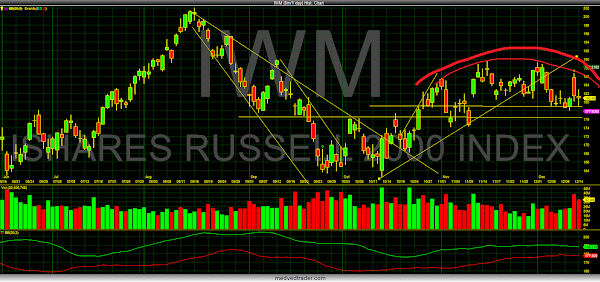
We've got some obvious rounding top formation going on in small-caps.
Subscribe to:
Posts (Atom)


