I've covered JVA on the blog for many years and shared my honest thoughts on the company. It's been so beaten down in this bear market it is now at .62% of net current asset value. In the past it would bottom out around net tangible asset value. This is one of those rarer cases where a profitable or recently former profitable company becomes a net current asset value stock.
If you are new to deep value the net current asset stocks get their attention because of famous investor Ben Graham who taught Warren Buffett. Net current asset value is a rought liquidation value of the whole company. Of course the true liquidatoin value is usually lower given the inventory and equipment and long-term assets are likely going to fetch less than on the books. They are usually priced so cheap for a reason too.
JVA is now merging with another company. Here is a piece of the SEC filing.
As a condition to the Merger, Pubco shall also acquire all of the issued and outstanding Delta securities from the Sellers in exchange for Pubco Ordinary Shares (the “Exchange” and, collectively with the Merger and the other transactions contemplated by the Merger Agreement, the “Transactions”).
As a result of Transactions, JVA and Delta will each become direct, wholly-owned subsidiaries of Pubco, with JVA stockholders receiving approximately $31.5 million (or 4.79%) worth of Pubco Ordinary Shares (the “Merger Consideration”) and Delta stockholders receiving approximately $625 million (or 95.21%) worth of Pubco Ordinary Shares (the “Exchange Consideration” and collectively with the Merger Consideration, the “Business Combination Consideration”), subject to certain adjustments, at an implied diluted value per share of $5.50.
The Business Combination Consideration may be adjusted if Delta closes certain acquisitions prior to the closing of the Transactions. The Merger Agreement also includes an earn-out to existing stockholders of Delta, consisting of $50 million of additional Pubco Ordinary Shares, which will be released to Delta stockholders if and when Delta achieves $70 million or greater of net income for fiscal year ending 2023.
The company they are merging with is private so I don't know anything about them.
Disclosure: I have a position in JVA
January 2, 2023
December 23, 2022
Net Current Asset Stocks
As the market continues to be weak I am going to start looking for cheap stocks below net current asset value and net tangible asset value. I just ran a strict scan looking for super discounted assets. This is the first scan I have done in awhile for these as I never thought it would produce much in the most recent bull market. This scan is cherry picked from criteria of price-to-book value of .5 or less, long-term debt to equity less than .3 and return on equity over 1.
The most interesting ones are Vaccitech plc (VACC) with NCAV of $187 million and a market cap of $89 mil. VACC has postive earnings this year with $.22 last quarter and $.42 the quarter before that. Cash has been pretty stable the past year and currently it has $200 mil in cash.
We also have TD Holdings, Inc. (GLG) with $154 mil in NCAV and a market cap of $59 mil. Not as much cash as VACC as the large majority of the current assets are in account receivables. They had a couple recent slightly positive quarters of $.02 earnings per share and $.05. The stock has tried to bottom and has been sideways for months with support around $1.00 a share.
December 14, 2022
Stock Market Top Bull Trap Set
You may remember my blog post from late October where I outlined the scenario of a stock market bottom. I gave the exact levels it would need to break through to confirm and had a good read on the price action down there. The very bottom came on CPI day in October. It was also a bear trap. A bear trap is where the price action begins to go lower enticing sellers and short sellers to sell. What happens though is the momentum quickly shifts back to bullish as price fails to continue to go lower. We saw an epic bear trap on that October day. It was one of the largest reversals from a 52 week low in history.
You may or may not have noticed that on CPI day this week the market shot up early but fell after the CPI news. It was another trap!! And on CPI day again! Maybe it's a big coincidence or the CPI and inflation expectations are the main driver of equities during this time. Inflation is one of the biggest economic factors affecting consumers and businesses these days and not to mention the FED's decisions. We can see the two CPI days in this chart and how it is breaking the uptrend line. It tried to reclaim trend support on the CPI day which was yesterday and that is when we got the big failed signal. Failed signals are powerfull. It will take something special to continue higher from here. I'm not yet fully committed to this being the top but if we see a break of the yellow line around 389.50 on SPY it's game on for more lows.
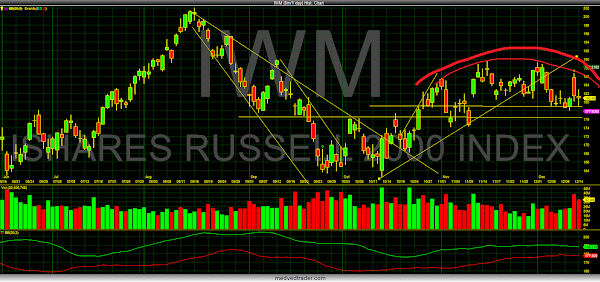
We've got some obvious rounding top formation going on in small-caps.
November 25, 2022
I-Robot IRBT Merger Arbitrage
As it still stands I-Robot (IRBT) is being acquired by Amazon (AMZN) for $61 per share in an all cash deal. The announcement was back in early August of this year. I-Robot stockholders have officially approved the merger with Amazon.
To analyze the opportunity here let's begin with the deal itself. All cash deals always have a higher likelyhood of going through and this one is approved by shareholders. So we have one checkbox marked off. Next is the spread worth it? With IRBT stock currently at $52.57 a share and the deal price being $61 we currently have a whopping 16% return. The next hurdle is the possiblity of regulatory action denying the merger. There is a lot of speculation this deal won't make it past regulatory approval. I remember when there was a lot of speculation on the Fitbit merger being blocked as well and it ended up going through anyway.
I think it is worth averaging into IRBT stock in small increments over coming weeks. The stock is down a lot and could just rise with the overall market even it doesn't get bought. So, I see the risk/reward being nice here. Artificial intelligence is forecast to be one the fastest growing markets over coming years. With the likelyhood of significant innovation IRBT will no doubt be a great company going forward.
November 23, 2022
Stock Market Rally Continues
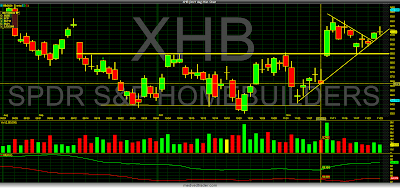
Since my recent posts about the market rally the major indices have held a steady uptrend. What I am seeing now is bonds especially in the ETF HYG actually "leading" equities higher. This happens from time to time in history. TLT and government bonds are leading too. I've been on Twitter a good bit and I am surprised more people are not paying attention to this. You heard it here. The bull momentum in many sectors is strong escpecially pivotal sectors like homebuilding and construction. This is seen in ETF's VNQ XHB.
I now see stocks continuing to move higher after the economic data is currently being shrugged off. A slow grind higher seems to be in the works. Even QQQ is acting bullish. I always stay open-minded and seperate fundamentals from trend when need be as we are seeing now. I learned in 2009 often major bottoms begin and continue on bad economic data and bad corporate news. Fighting an uptrend is futile. The market is always forward looking. Here are some charts to add a little clarity to the bullish sentiment.
I now see stocks continuing to move higher after the economic data is currently being shrugged off. A slow grind higher seems to be in the works. Even QQQ is acting bullish. I always stay open-minded and seperate fundamentals from trend when need be as we are seeing now. I learned in 2009 often major bottoms begin and continue on bad economic data and bad corporate news. Fighting an uptrend is futile. The market is always forward looking. Here are some charts to add a little clarity to the bullish sentiment.
Subscribe to:
Posts (Atom)


